Overview
The purpose / goal for this project is to use the financial and email data available to us from the Enron Fraud case and determine who are the people of interest and who warrants further investigation. Whilst the data is historic and the people have been already identifed publicly, this project is using Machine Learning to identify these people through the use of data.
In 2000, Enron was one of the largest companies in the United States. By 2002, it had collapsed into bankruptcy due to widespread corporate fraud. In the resulting Federal investigation, a significant amount of typically confidential information entered into the public record, including tens of thousands of emails and detailed financial data for top executives.
Source Code for ProjectData Analysis
| Description | Result |
|---|---|
| Number of people | 146 |
| Number of People of Interest | 18 |
| Number of Features / Variables | 21 |
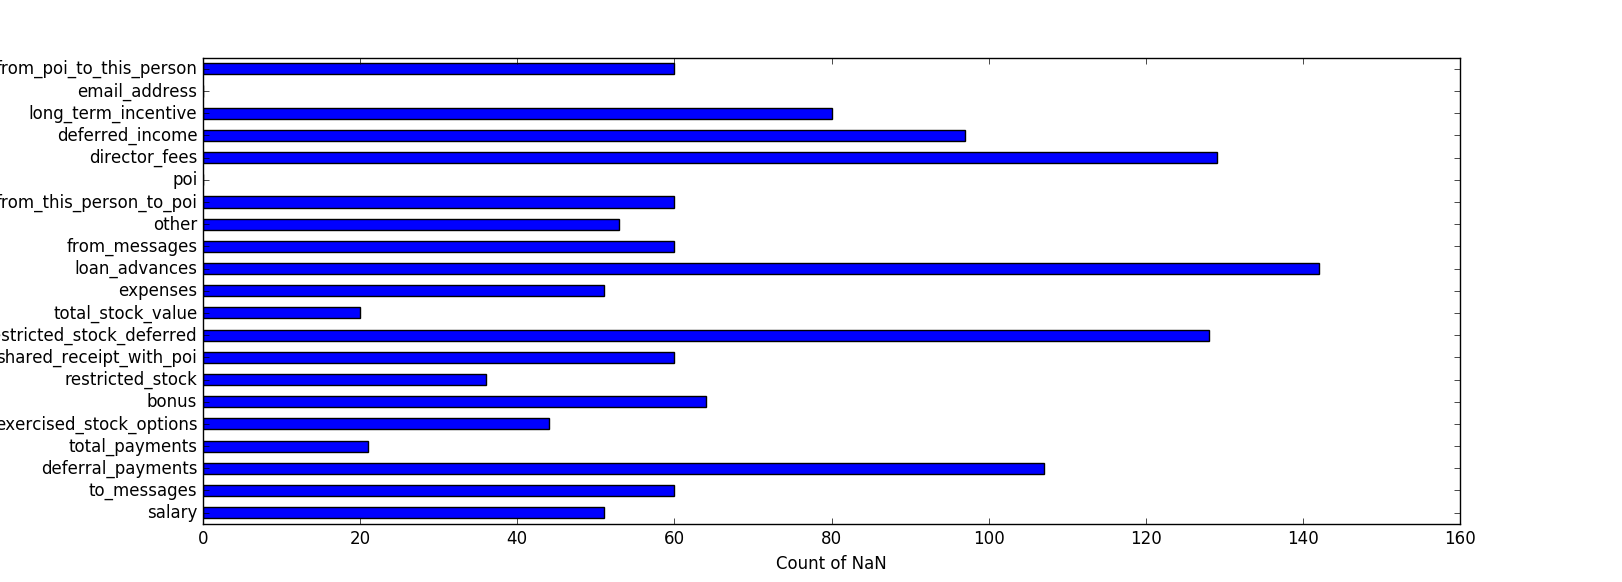
Cleanliness / Completness of data
The table below shows that the financial / payment data is missing for about 14.38% of people in the dataset, however there is 0% missing for the people of interest.
| Description | Result |
|---|---|
| Percentage of people with no payment data | 14.4% |
| Percentage of POI with no payment data | 0.0% |
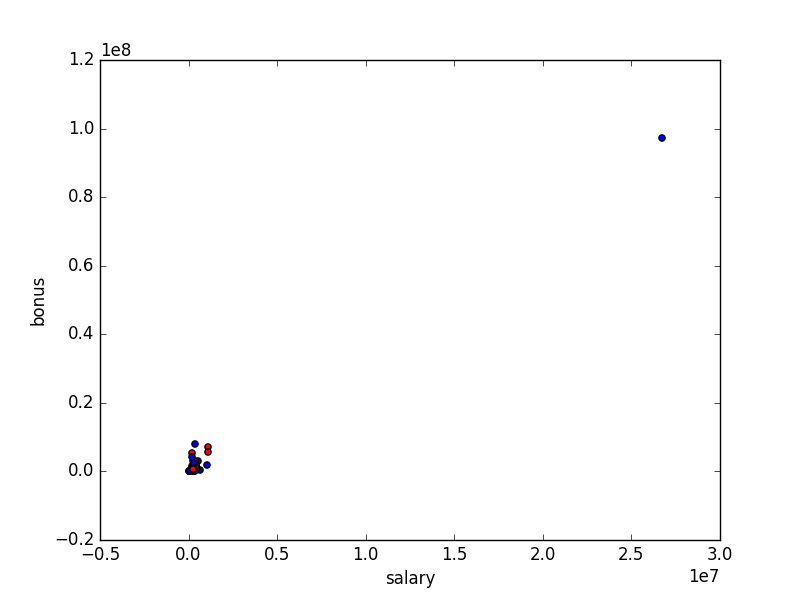
Outliers
During the initial analysis of the data and by plotting features such as Salaries vs Bonuses, I was able to identify that there was one significant outlier. This outlier was caused by the total row been added to the dataset.
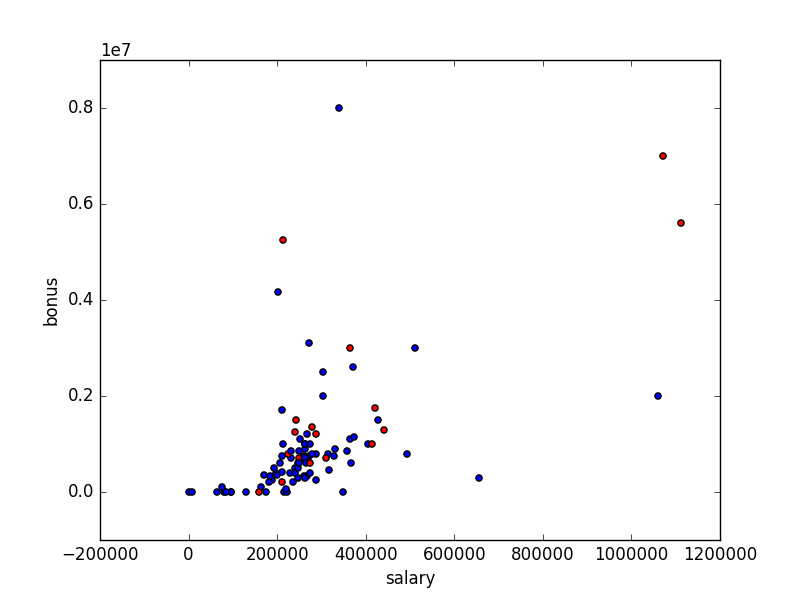
Other options for removing outliers would be to remove 10% of the plots that have the highest error or difference to the linear regression model, however in this instance I will not be doing this as the remaining outliers in the data represent the top positions from Enron and would warrant further investigation.
Features
The original dataset contains the following features:
- poi (flag for identifying Person of Interest 0 or 1)
- Financial:
- salary
- deferral_payments
- total_payments
- exercised_stock_options
- bonus
- restricted_stock
- restricted_stock_deferred
- total_stock_value
- expenses
- loan_advances
- other
- director_fees
- deferred_income
- long_term_incentive
- Messages:
- to_messages
- shared_receipt_with_poi
- from_messages
- from_this_person_to_poi
- email_address
- from_poi_to_this_person
Feature Creation
After exploring the above features I decided to create the following addtional features, to see if they made a difference to the results of the algorithm:
Note: Prior to adding any new features the precision score was 0.77968 and the recall scrore was 0.31850
total_messages: to_messages + from_messages This feature was created to see if the total number of emails sent and received increased for POI's. After creating this feature I was able to see that this featured made no impact on the precision and recall, as it did not rank in the top 10 features.
total_messages_with_poi: from_this_person_to_poi + from_poi_to_this_person + shared_receipt_with_poi After I seen that the previous feature made no impact I decided to see if the number of messages between POI's made an impact. Once this feature was added it was included in the top 10 features and the precision increased to 0.84384, however the recall score dropped slightly to 0.308
message_shared_fraction: total_messages_with_poi / total_messages Once I had seen that the previous feature increased the precision, I then wanted to see if there was a relationship between the total messages and the total messages with POI's.
excerised_stock_ratio: exercised_stock_options / total_stock_value The next feature I created was based on the value of the excerised stock options vs the total value of the stock. This feature was useful for the DecisionTreeClassifier algorithm, but made no impact on the KNeighborsClassifier.
Feature Selection
Once these features were created I then had to decide on which features were important to training the machine learning algorithm. At this stage I was still undecided on which algorithm I would be using and I believe that the importance of the features would be different depending on the algorithm.
How many features?
In order to select the best number of features to use, I loop through the number of features and performing the SelectKBest algorithm. The loop returned the Precision, Recall and F1 score for each number of features, from 1 - 24. I was then able to plot the results of the loop and visually see which number of features produced the best results. The plot showed that 10 and 11 features produced the best results.

Scaling Features
Since some of the feature values had such a large range of values, for example the Salary Feature ranged from $477 - $1,111,258, I decided to apply a MinMaxScaler. The MinMaxScaler adjusts the feature values and scales them so that any patterns can be identified easier.
DecisionTreeClassifier - Feature Importance
In order to select the best features I ran a DecisionTreeClassifier over the training data and extracted the top ranked features. The top 10 features and scores are showng in the table below:
| Feature | Score |
|---|---|
| exercised_stock_options | 0.26323 |
| other | 0.19605 |
| expenses | 0.14502 |
| total_payments | 0.11180 |
| long_term_incentive | 0.10714 |
| deferred_income | 0.10627 |
| excerised_stock_ratio | 0.05357 |
| bonus | 0.01690 |
| to_messages | 0.0 |
| deferral_payments | 0.0 |
SelectKBest - Feature Selection
I also used SelectKBest to choose the top 10 features for other algorithms (GaussianNB and KNeighborsClassifier). The SelectKBest produced a different list of features, which incorporated some more of the features about emails. The results are shown below:
| Feature | Score |
|---|---|
| total_stock_value | 14.6913 |
| exercised_stock_options | 13.7140 |
| salary | 11.1962 |
| bonus | 11.129 |
| message_shared_fraction | 6.8738 |
| restricted_stock | 6.5769 |
| expenses | 5.9062 |
| total_messages_with_poi | 5.6090 |
| shared_receipt_with_poi | 5.4953 |
| deferred_income | 5.3040 |
Algorithm
For this project I tested GaussianNB (NaiveBayes), DecisionTreeClassifier, and KNeighborsClassifier, with both lists of features produced by the Feature Selection processes mentioned above. During the testing of the algorithms, I found that prior to any tuning of the algorithms the GaussianNB algorithm performed best, with the highest accuracy (noting that due to the way the data is skewed the accuracy score is not the best measure to use here), precision_score and recall_score. However the False Positives were still high (1145)
Since there are tuning options available for GaussianNB, I decided to tune the DecisionTreeClassifier and KNeighborsClassifier, which produced better results. In the end I decided to use the tuned version of the KNeighborsClassifier
Tuning the Algorithm
Tuning the algorithm means to adjust the input parameters of the algorithm to ensure the best performance for the dataset and selected features. If a algorithm is not tuned correctly there is a potential that the incorrect results are presented and the best performance may not be achieved. However the effectiveness of the tuning will also depend on the algorithm chosen and the features selected.
As I had decided to use the KNeighborsClassifier algorithm I was able to tune the algorithm to improve the performance and achieve better results. For example prior to tuning the KNeighborsClassifier I was getting the following results:
However after tuning the algorith I was able to get the following results:
In order to determine the best input parameters for the KNeighborsClassifier, I used a grid search which allowed me to provide a range of parameters, which provided 1280 different models to test and return the parameters with best score, based on the scoring metric selected, in this case I used "precision". The best parameters that were returned were:
I also applied a similar approach to tuning the DecisionTreeClassifier to see how the results would differ. The GaussianNB algorithm does not have any input parameters and therefore cannot be tuned.
Validation
Validation is how we go about testing our algorithm. Validating the algorithm is a process in which we use training data and then compare the results to test data. The benefits of splitting the data into training and test sets, allows us to make sure that we are not overfitting the data and provides a mechanism for testing the algorithm to determine if we are getting the desired results. When splitting the data into the training and test sets there is the risk that the results could be skewed, if the split isn't selected randomly. For example if the dataset for Enron was sorted by the POI identifier and split in half, the training data would contain features for people who are not a POI, which would mean that when testing the algorithm the results may be unexpected and different to the training results.
In this project I used StratifiedShuffle to split the data into 2 sets: training data and test data. Other options would be to use either K-Fold or Cross_Validation.Train_Test_split. The reason I chose the StratifiedShuffle was because it was the same as the splitter that was used in the tester.py script and I believe that it provides a more random result, based on the parameters.
Evaluation Metrics
sklearn provides a number of built-in evaluation metrics including:
Accuracy
Recall
Precision
So that I could see how the different algorithms performed against the tester.py script I decided to use the test_classifier function, however normally I would use the metric calculations provided by the sklearn.metrics module. The results of the were as followed:
GaussianNB - using SelectKBest features
Accuracy: 0.83960	Precision: 0.39225	Recall: 0.36950	F1: 0.38054	F2: 0.37384
Total predictions: 15000 True positives:  739	False positives: 1145	False negatives: 1261	True negatives: 11855
DecisionTreeClassifier - using SelectKBest features
Accuracy: 0.80847	Precision: 0.24607	Recall: 0.21150	F1: 0.22748	F2: 0.21761
Total predictions: 15000 True positives:  423	False positives: 1296	False negatives: 1577	True negatives: 11704
KNeighborsClassifier - using SelectKBest features
Accuracy: 0.90013	Precision: 0.84384	Recall: 0.30800	F1: 0.45128	F2: 0.35281
Total predictions: 15000 True positives:  616	False positives:  114	False negatives: 1384	True negatives: 12886
GaussianNB - using DecisionTree features
Accuracy: 0.84193	Precision: 0.37109	Recall: 0.26700	F1: 0.31056	F2: 0.28287
Total predictions: 15000 True positives:  534	False positives:  905	False negatives: 1466	True negatives: 12095
DecisionTreeClassifier - using DecisionTree features
Accuracy: 0.82440	Precision: 0.30212	Recall: 0.24200	F1: 0.26874	F2: 0.25203
Total predictions: 15000 True positives:  484	False positives: 1118	False negatives: 1516	True negatives: 11882
KNeighborsClassifier - using DecisionTree features
Accuracy: 0.88767	Precision: 0.80000	Recall: 0.21000	F1: 0.33267	F2: 0.24633
Total predictions: 15000 True positives:  420	False positives:  105	False negatives: 1580	True negatives: 12895